Overview of key figures
Revenues significantly above pre-Covid-19 level, operating profit significantly positive again.
Read more
In Germany, punctuality in rail transport decreased significantly.
Read more
As part of our DB Group climate protection target, in 2022, we were able to further reduce specific greenhouse gas emissions.
Read more
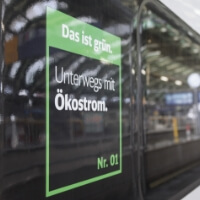
In 2022, we also increased the share of renewable energies in the DB rail traction current mix in Germany.
Read more
External new hires in Germany (excluding young professionals) in NP.
Read more


Employee satisfaction
Employee satisfaction is determined every two years as part of the employee survey ... read more
New hires
In 2022, about 26,700 new employees in Germany completed their first working day at DB Group ... read more
Work of the future
In order to strengthen our ability to innovate and prepare ourselves for the future, we intend to actively shape the work of the future in DB Group ... read more
Diversity
DB Group’s commitment to the diversity of its employees is anchored in the Strong Rail strategy ... read more
Employment conditions
We are continuing to improve employment conditions, based on current and future social developments, as well as employees’ and applicants’ expectations of ... read more
Employer attractiveness
In 2022, we continued our employment campaign despite a tense labor market ... read more