Development in the year under review
- Declining demand for traction current – industrial customer business growing.
- Significant price increases on the primary energy markets, which can only be partially passed on to customers.
- Increased capital expenditures in new construction and renovation of traction current lines.
DB Netze Energy | 2018 | 2017 | Change | 2016 | ||
absolute | % | |||||
Supply reliability (%) | 99.991) | 99.991) | – | – | 99.99 | |
Customer satisfaction2) (SI) | 78 | – | – | – | 80 | |
Customer satisfaction, traction current and diesel2) (SI) | 75 | – | – | – | 80 | |
Customer satisfaction, electricity and gas plus (intra-Group customers)2) (SI) | 79 | – | – | – | 79 | |
Customer satisfaction, electricity and gas plus (non-Group customers) 2) (SI) | 81 | – | – | – | 82 | |
Traction current (16.7 Hz and direct current) (GWh) | 8,245 | 8,284 | – 39 | – 0.5 | 8,902 | |
Traction current pass-through (16.7 Hz) (GWh) | 1,576 | 1,906 | –330 | –17.3 | 1,419 | |
Stationary energy (50 Hz and 16.7 Hz) (GWh) | 18,196 | 19,331 | –1,135 | – 5.9 | 17,589 | |
Diesel fuel (million l) | 429.6 | 436.1 | – 6.5 | – 1.5 | 433.7 | |
Total revenues (€ million) | 2.850 | 2.794 | +56 | +2.0 | 2,779 | |
External revenues (€ million) | 1.350 | 1.301 | +49 | +3.8 | 1,194 | |
EBITDA adjusted (€ million) | 87 | 141 | –54 | –38.3 | 197 | |
EBIT adjusted (€ million) | 21 | 72 | –51 | –70.8 | 126 | |
ROCE (%) | 2.0 | 6.7 | – | – | 14.3 | |
Capital employed as of Dec 31 (€ million) | 1,053 | 1,081 | –28 | –2.6 | 878 | |
Net financial debt as of Dec 31 (€ million) | 623 | 630 | – 7 | –1.1 | 390 | |
Redemption coverage (%) | 9,8 | 17,7 | – | – | 32.9 | |
Gross capital expenditures (€ million) | 187 | 177 | +10 | +5.6 | 174 | |
Net capital expenditures (€ million) | 65 | 53 | +12 | +22.6 | 52 | |
Employees as of Dec 31 (FTE) | 1,734 | 1,721 | + 13 | + 0.8 | 1,736 | |
Employee satisfaction (SI) | 3.8 | – | – | – | 3.8 | |
Employee satisfaction – follow-up workshop implementation rate (%) | – | 100 | – | – | – | |
Share of women in Germany as of Dec 31 (%) | 13.8 | 13.5 | – | – | 13.3 | |
Share of renewable energies in the DB traction current mix (%) | 57.2 | 44.0 | – | – | 42.0 |
1) Preliminary figure (not rounded).
2) No survey conducted in 2017.
Supply reliability remained at its previous high level.
We surveyed about 250 customers regarding customer satisfaction. Following the change in our data collection cycle, there was no measurement of customer satisfaction in the previous year. Customer satisfaction in the year under review was again high. The reduction in comparison to 2016 can be explained by changes in the area of traction current.
Development declined in volume terms:
- Sales of traction current declined slightly. The lower demand from intra-Group customers, particularly from freight transport, was largely compensated by increased demand from non-Group customers.
- The traction current volume passed through on behalf of non-Group customers decreased primarily because of the non-recurrence of one-off effects of the previous year.
- In stationary energy, the sales volume decreased. The key factor here was the reduced opportunities for optimization on the electricity market. On the opposite side, business with industrial customers increased.
- The declining demand for diesel fuels is attributable to the development of intra-Group customers in freight and regional passenger transport.
The economic development declined significantly. Sharp increases in purchase prices on the primary energy markets could only be partially compensated by revenue growth, meaning that the operating profit figures worsened.
- Revenues were higher than in the previous year as a result of price and volume increases in the industrial customer business, along with higher sales prices for mineral oil products. Decreased demand from intra-Group customers and declining sales volumes from the transmission of traction energy was therefore more than compensated.
- The significant increase in other operational income (+ 58.2%) resulted from positive effects from the release of provisions and increased insurance income.
On the expenses side, higher energy purchase prices was the key factor:
- Cost of materials (+ 6.5%) rose significantly. Negative effects from increased primary energy prices for electricity and mineral oil products were only marginally compensated by decreased purchase volumes.
- Personnel expenses (+ 3.3%) increased primarily as a result of collective bargaining agreements.
- The decrease in other operating expenses (– 13.3%) can first and foremost be explained by changes to presentation not affecting profits. Cost of materials worsened by a counteracting effect.
- The decrease in depreciation (– 4.3%) resulted from the adjustment of the balance sheet useful life of individual energy production facilities.
ROCE worsened significantly as a result of a disproportionate decrease in operating profit in comparison to capital employed. The decrease in capital employed is explained particularly by temporarily increased liabilities for energy procurement.
The significant decrease in redemption coverage resulted primarily from operating cash flow that was in sharp decline. The slightly lower net financial debt was supportive.
Increased capital expenditures in building new traction current lines and modernizing existing ones resulted in an increase in volume of capital expenditures.
The number of employees increased slightly.
Employee satisfaction is measured every two years. The satisfaction index remained stable.
The share of women remained unchanged.
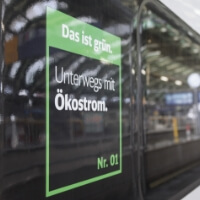
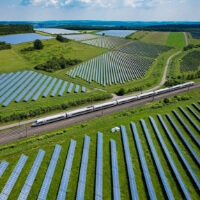
The share of renewable energies in the DB traction current mix increased significantly.