2018 Integrated Report – On track towards a better Railway

Development of business units

Development in the year under review

  • Increased demand from additional traffic and increased schedule frequencies.
  • Burdens on profits by cost increases (particularly in personnel and quality improvement measures).
  • Leasing business stable.

DB Netze Stations

2018

2017

Change

2016

absolute

%


Stations

5.368

5,365

+3

+0.1

5,367

Facilities quality (grade)

2.88 1)

2.89 1)

2.92

Customer satisfaction, traffic station (passengers/visitors) (SI)

68

69

69

Customer satisfaction, traffic station (TOCs and transport authorities) (SI)

61

62

62

Customer satisfaction, tenants (SI)

76

78

78

Stationshalte in Mio.

150.9

150.0

+ 0.9

+ 0.6

149.4

     thereof non-Group railways

36.8

35.9

+ 0.9

+ 2.5

35.3

Total revenues (€ million)

1,314

1,265

+ 49

+ 3.9

1,233

     thereof station revenues (€ million)

880

851

+ 29

+ 3.4

831

     thereof rental (€ million)

391

384

+7

+1.8

377

External revenues (€ million)

569

540

+ 29

+ 5.4

519

EBITDA adjusted (€ million)

362

372

– 10

– 2.7

359

EBIT adjusted (€ million)

221

233

– 12

– 5.2

221

ROCE (%)

8.0

8.4

7.9

Capital employed as of Dec 31 (€ million)

2,758

2,766

– 8

– 0.3

2,777

Net financial debt as of Dec 31 (€ million)

1,260

1,268

– 8

– 0.6

1,257

Redemption coverage (%)

22.7

23.0

22.0

Gross capital expenditures (€ million)

883

709

+ 174

+ 24.5

584

Net capital expenditures (€ million)

164

103

+ 61

+ 59.2

117

 Employees as of Dec 31 (FTE)

5,804

5,463

+ 341

+ 6.2

5,093

Employee satisfaction (SI)

3.7

3.7

Employee satisfaction – follow-up workshop implementation rate (%)

97.8

Share of women in Germany as of Dec 31 (%)

45.2

46.2

47.3

 Absolute primary energy consumption (stations) compared to 2010 (%)

–20.5

–17.1

–16.8

1) Preliminary figure.

Facilities quality is assessed locally and is determined on the basis of a detailed calculation and weighting algorithm in accordance with the provisions of the LuFV II Facilities quality remained stable at a good level.

Customer satisfaction worsened slightly. Lower scores, particularly on the issues of information about construction work, equipment and status of stations and visual and audio information should be noted. To assess customer satisfaction, about 27,000 passengers are asked each year, in two waves, about their satisfaction with the stations, and about 60 tenants and 90 public transport authorities are surveyed annually.

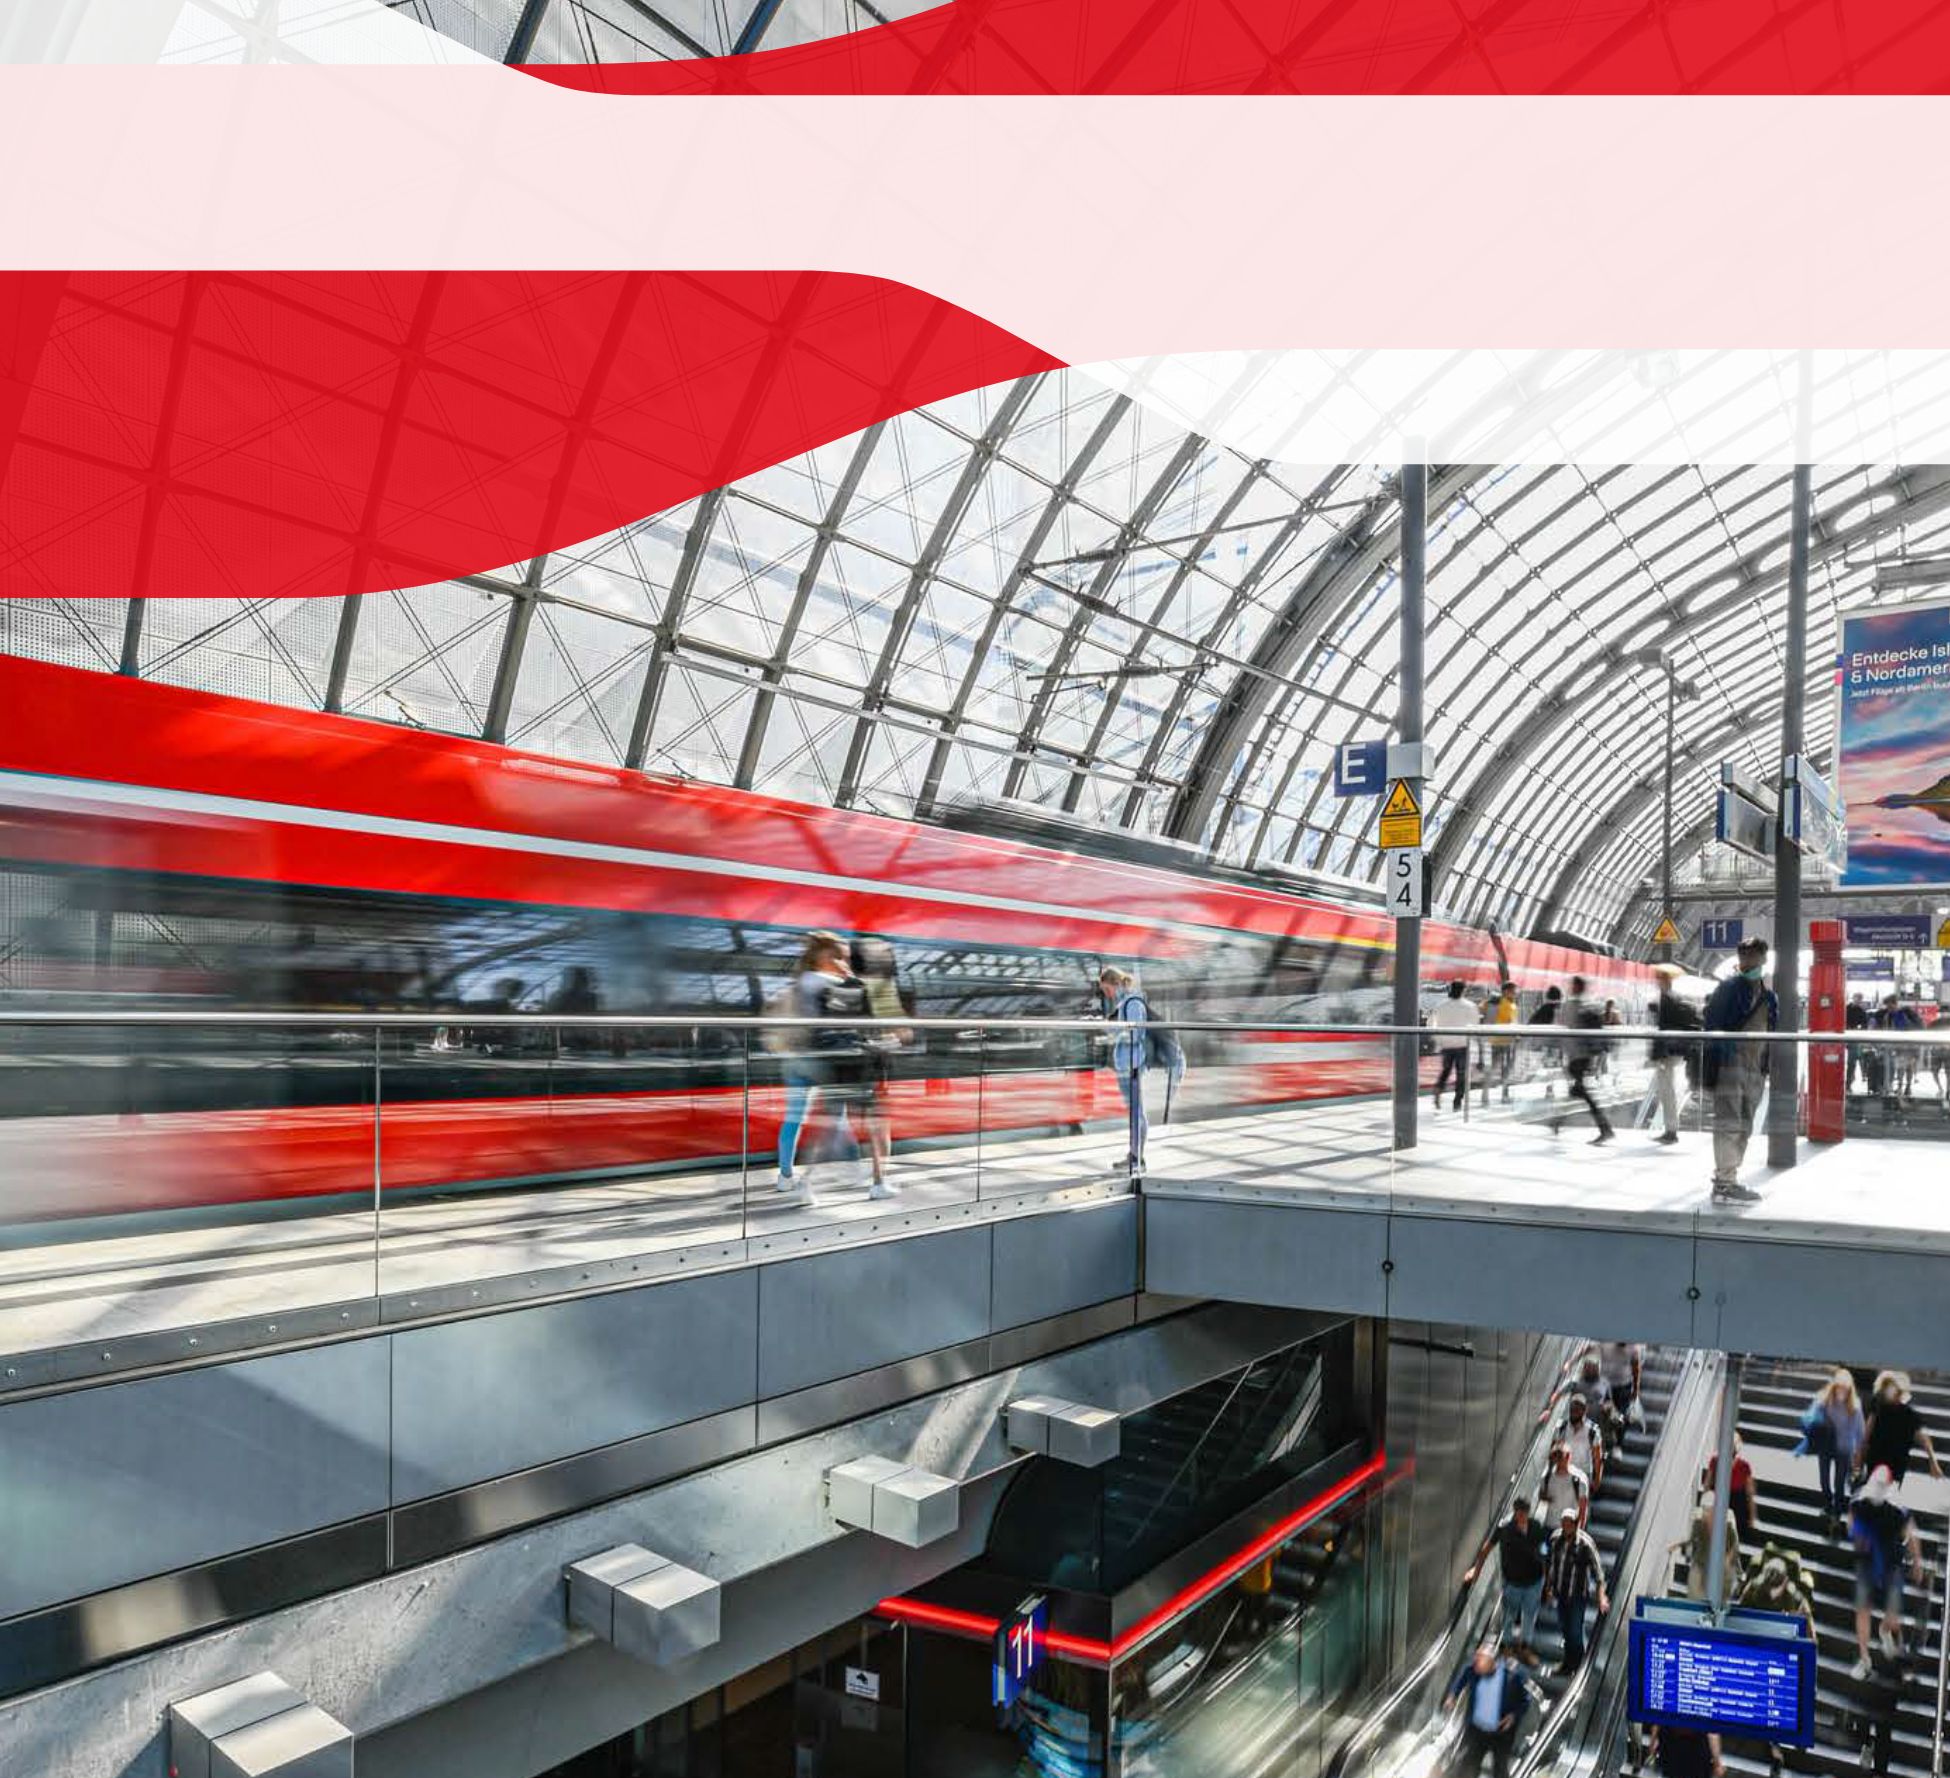
Performance development was marked by a slight in­­crease in the number of station stops. This was mainly due to increased schedule frequencies and additional traffic in regional transport. In particular, the higher demand was driven by non-Group railways.

The economic development was negative: significant ex­­pense increases, particularly for additional quality-improvement measures and in the area of personnel, could not be completely compensated by growth on the income side, meaning that the operating profit figures decreased.

  • The rise in revenues is attributable to higher station revenues primarily as a result of prices as well as higher revenues from rental and leasing. Improved performance also supported station revenues. The development of external revenues reflects the growing market share of non-Group railways.
  • Other operating income (+ 21.8%) also grew strongly, primarily as a result of higher investment grants and increased income from selling real estate.

On the expenses side there were significant additional charges:

  • Cost of materials (+ 10.2%) rose just as significantly, particularly as a result of additional quality improvement measures and higher expenses for maintenance. Lower energy expenses partially compensated this.
  • Personnel expenses (+ 8.0%) rose sharply as a result of collective bargaining agreements and a larger number of employees.
  • The increase in other operating expenses (+ 9.7) was partially due to increased IT and communication services, also resulting partially from the larger number of employees. Alongside rental expenses, disposals of property, plant and equipment also increased.
  • Depreciation increased (+ 1.4%) in the wake of the larger volume of capital expenditures.

Declining EBIT development led to a worsening of ROCE, as capital employed continued to develop in an almost stable manner.

Net financial debt decreased slightly, mainly because of working capital effects.

Redemption coverage worsened, primarily as a result 
of lower operating cash flows caused by the profit devel­opment.

The higher capital expenditures were focused primarily on renovating existing stations and quality-improvement projects.

The number of employees rose principally because of staff increases in the areas of construction and facilities management.

Employee satisfaction is measured every two years. The satisfaction index remained stable.

The share of women decreased slightly.

With the further reduction of the primary energy consumption of the stations in comparison to 2010, for example through the use of energy saving technologies, the positive trend of the past years is continuing.