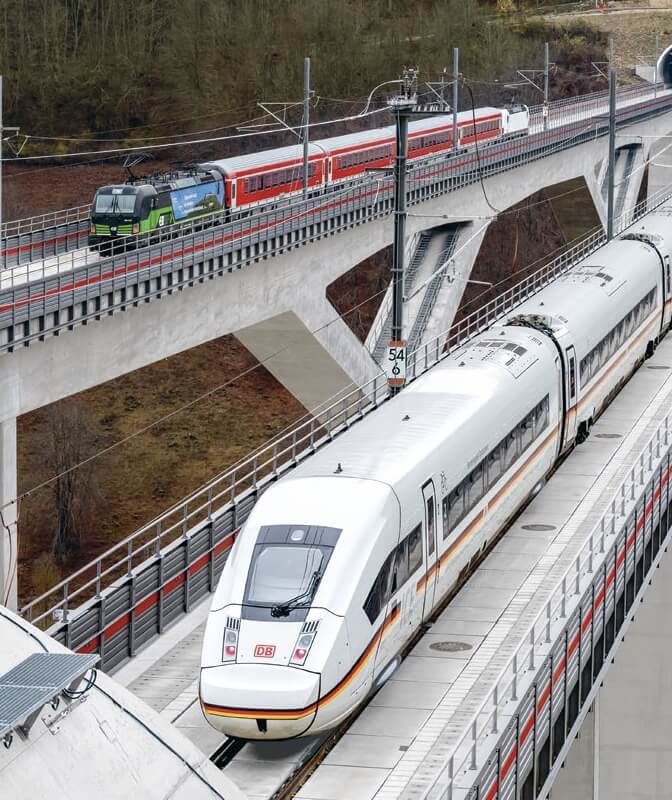
Overview of business units
Revenues adjusted (€ million) | Total revenues | Change | External revenues | Change | |||||
2018 | 2017 | absolute | % | 2018 | 2017 | absolute | % | ||
DB Long-Distance | 4,682 | 4,347 | + 335 | + 7.7 | 4,528 | 4,193 | + 335 | + 8.0 | |
DB Regional | 8,968 | 8,734 | + 234 | + 2.7 | 8,862 | 8,629 | + 233 | + 2.7 | |
DB Arriva | 5,441 | 5,345 | + 96 | + 1.8 | 5,433 | 5,338 | + 95 | + 1.8 | |
DB Cargo | 4,460 | 4,528 | – 68 | – 1.5 | 4,177 | 4,209 | – 32 | – 0.8 | |
DB Schenker | 17,050 | 16,430 | + 620 | + 3.8 | 16,973 | 16,345 | + 628 | + 3.8 | |
DB Netze Track | 5,511 | 5,364 | + 147 | + 2.7 | 1,559 | 1,522 | + 37 | + 2.4 | |
DB Netze Stations | 1,314 | 1,265 | + 49 | + 3.9 | 569 | 540 | + 29 | + 5.4 | |
DB Netze Energy | 2,850 | 2,794 | + 56 | + 2.0 | 1,350 | 1,301 | + 49 | + 3.8 | |
Other | 4,990 | 4,854 | + 136 | + 2.8 | 573 | 627 | – 54 | – 8.6 | |
Consolidation | – 11,242 | – 10,957 | – 285 | + 2.6 | – | – | – | – | |
DB Group | 44,024 | 42,704 | + 1,320 | + 3.1 | 44,024 | 42,704 | + 1,320 | + 3.1 |
Operating profitfigures (€ million) | EBITDA adjusted | Change | EBIT adjusted | Change | |||||
2018 | 2017 | absolute | % | 2018 | 2017 | absolute | % | ||
DB Long-Distance | 675 | 611 | + 64 | + 10.5 | 417 | 381 | + 36 | + 9.4 | |
DB Regional | 1,126 | 1,156 | – 30 | – 2.6 | 492 | 508 | – 16 | – 3.1 | |
DB Arriva | 575 | 569 | + 6 | + 1.1 | 300 | 301 | – 1 | – 0.3 | |
DB Cargo | 54 | 130 | – 76 | – 58.5 | – 190 | – 90 | – 100 | + 111 | |
DB Schenker | 703 | 676 | + 27 | + 4.0 | 503 | 477 | + 26 | + 5.5 | |
DB Netze Track | 1,446 | 1,484 | – 38 | – 2.6 | 840 | 687 | + 153 | + 22.3 | |
DB Netze Stations | 362 | 372 | – 10 | – 2.7 | 221 | 233 | – 12 | – 5.2 | |
DB Netze Energy | 87 | 141 | – 54 | – 38.3 | 21 | 72 | – 51 | – 70.8 | |
Other/Consolidation | – 289 | – 209 | – 80 | + 38.3 | – 493 | – 417 | – 76 | + 18.2 | |
DB Group | 4,739 | 4,930 | – 191 | – 3.9 | 2,111 | 2,152 | – 41 | – 1.9 | |
Margin (%) | 10.8 | 11.5 | – | – | 4.8 | 5.0 | – | – |
Capital expenditures (€ million) | Gross capital expenditures | Change | Net capital expenditures | Change | |||||
2018 | 2017 | absolute | % | 2018 | 2017 | absolute | % | ||
DB Long-Distance | 1,081 | 1,060 | + 21 | + 2.0 | 1,081 | 1,060 | + 21 | + 2.0 | |
DB Regional | 539 | 674 | – 135 | – 20.0 | 526 | 628 | – 102 | – 16.2 | |
DB Arriva | 326 | 374 | – 48 | – 12.8 | 312 | 372 | – 60 | – 16.1 | |
DB Cargo | 587 | 328 | + 259 | + 79.0 | 586 | 324 | + 262 | + 80.9 | |
DB Schenker | 273 | 246 | + 27 | + 11.0 | 273 | 246 | + 27 | + 11.0 | |
DB Netze Track | 6,901 | 6,601 | + 300 | + 4.5 | 564 | 660 | – 96 | – 14.5 | |
DB Netze Stations | 883 | 709 | + 174 | + 24.5 | 164 | 103 | + 61 | + 59.2 | |
DB Netze Energy | 187 | 177 | + 10 | + 5.6 | 65 | 53 | + 12 | + 22.6 | |
Other/Consildation | 428 | 295 | + 133 | + 45.1 | 425 | 294 | + 131 | + 44.6 | |
DB Group | 11,205 | 10,464 | + 741 | + 7.1 | 3,996 | 3,740 | + 256 | + 6.8 | |
thereof investment grants | 7,209 | 6,724 | + 485 | + 7.2 | – | – | – | – |