Capital expenditures
| CAPITAL EXPENDITURES / € million | 2021 | 2020 | Change | 2019 | ||
absolute | % | |||||
Gross capital expenditures | 15,387 | 14,402 | +985 | +6.8 | 13,093 | |
thereof Integrated Rail System | 14,276 | 13,128 | +1,148 | +8.7 | 11,713 | |
Investment grants | 9,045 | 8,516 | +529 | +6.2 | 7,447 | |
thereof Integrated Rail System | 9,027 | 8,494 | +533 | +6.3 | 7,412 | |
Net capital expenditures | 6,342 | 5,886 | +456 | +7.7 | 5,646 | |
thereof Integrated Rail System | 5,249 | 4,634 | +615 | +13.3 | 4,301 | |
The increase in gross capital expenditures was driven by the Integrated Rail System and resulted mainly from higher capital expenditure in the infrastructure and vehicle fleet. The decline in capital expenditure activities at DB Arriva (mainly completed vehicle projects for new transport contracts and the cessation of the ARN franchise) partially countered this impact.
Investment grants, which are almost exclusively allocated to the Integrated Rail System, also increased significantly. They accounted for about 59% of the gross capital expenditures.
Net capital expenditures were also significantly higher. The effects on the Integrated Rail System included the increase in capital expenditures in the existing network at DB Netze Track and in vehicles, particularly at DB Long-Distance.
The focus of our capital expenditure activities continues to center on the Integrated Rail System for measures to improve performance and efficiency in the track infrastructure sector as well as measures to develop our vehicle fleet.
| GROSS CAPITAL EXPENDITURES BY REGIONS / € million | 2021 | 2020 | Change | 2019 | ||
absolute | % | |||||
Germany | 14,363 | 13,282 | +1,081 | +8.1 | 11,826 | |
Europe (excluding Germany) | 833 | 1,012 | –179 | –17.7 | 1,186 | |
Asia/Pacific | 258 | 182 | +76 | +41.8 | 133 | |
North America | 40 | 38 | +2 | +5.3 | 37 | |
Rest of world | 13 | 8 | +5 | +62.5 | 13 | |
Consolidation | –120 | –120 | – | – | ‒102 | |
DB Group | 15,387 | 14,402 | +985 | +6.8 | 13,093 | |
| NET CAPITAL EXPENDITURES BY REGIONS / € million | 2021 | 2020 | Change | 2019 | ||
absolute | % | |||||
Germany | 5,338 | 4,788 | +550 | +11.5 | 4,414 | |
Europe (excluding Germany) | 813 | 990 | –177 | –17.9 | 1,151 | |
Asia/Pacific | 258 | 182 | +76 | +41.8 | 133 | |
North America | 40 | 38 | +2 | +5.3 | 37 | |
Rest of world | 13 | 8 | +5 | +62.5 | 13 | |
Consolidation | –120 | –120 | – | – | ‒102 | |
DB Group | 6,342 | 5,886 | +456 | +7.7 | 5,646 | |
In the regional breakdown of gross capital expenditures, the focus remained on Germany. The increase is due primarily to infrastructure measures and vehicle purchases.
Capital expenditures have decreased in Europe (excluding Germany). This was mainly due to lower capital expenditures at DB Arriva, particularly in the Czech Republic and Denmark.
In the Asia/Pacific region, DB Schenker invested more heavily in logistics facilities in China (including Hong Kong) and Japan.
| BRUTTO-INVESTITIONEN NACH REGIONEN / in Mio. € | 2021 | 2020 | Veränderung | 2019 | ||
absolut | % | |||||
Deutschland | 14.363 | 13.282 | + 1.081 | + 8,1 | 11.826 | |
Europa (ohne Deutschland) | 833 | 1.012 | – 179 | – 17,7 | 1.186 | |
Asien/Pazifik | 258 | 182 | + 76 | + 41,8 | 133 | |
Nordamerika | 40 | 38 | + 2 | + 5,3 | 37 | |
Übrige Welt | 13 | 8 | + 5 | + 62,5 | 13 | |
Konsolidierung | – 120 | – 120 | – | – | ‒102 | |
DB-Konzern | 15.387 | 14.402 | + 985 | + 6,8 | 13.093 | |
| NETTO-INVESTITIONEN NACH REGIONEN / in Mio. € | 2021 | 2020 | Veränderung | 2019 | ||
absolut | % | |||||
Deutschland | 5.338 | 4.788 | + 550 | + 11,5 | 4.414 | |
Europa (ohne Deutschland) | 813 | 990 | – 177 | – 17,9 | 1.151 | |
Asien/Pazifik | 258 | 182 | + 76 | + 41,8 | 133 | |
Nordamerika | 40 | 38 | + 2 | + 5,3 | 37 | |
Übrige Welt | 13 | 8 | + 5 | + 62,5 | 13 | |
Konsolidierung | – 120 | – 120 | – | – | ‒102 | |
DB-Konzern | 6.342 | 5.886 | + 456 | + 7,7 | 5.646 | |
In der regionalen Verteilung der Brutto-Investitionen lag der Schwerpunkt unverändert in Deutschland. Der Anstieg ist v.a. auf Infrastrukturmaßnahmen sowie Fahrzeugbeschaffungen zurückzuführen.
In Europa (ohne Deutschland) sind die Investitionen gesunken. Hier wirkten im Wesentlichen niedrigere Investitionen bei DB Arriva, insbesondere in Tschechien und Dänemark.
In der Region Asien/Pazifik investierte DB Schenker verstärkt in logistische Anlagen in China (inkl. Hongkong) und Japan.

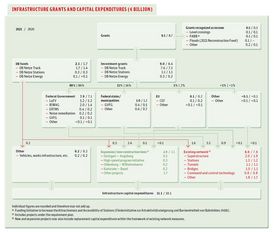
The most important funding sources for capital expenditures on infrastructure are grants, mostly from the Federal Government and from Federal states and local authorities. Of the investment grants received by DB Group in 2021, the vast majority related to infrastructure.
- The main bases for these grants are the LuFV and the Federal Rail Infrastructure Extension Act (Bundesschienenwegeausbaugesetz; BSWAG).
- Additional investment grants are received in accordance with the Municipal Transport Financing Act (Gemeindeverkehrsfinanzierungsgesetz; GVFG),
- the Federal Government’s noise remediation program, and
- to equip the infrastructure with the European Rail Traffic Management System (ERTMS).
- Funds are also available from the 2021 Reconstruction Fund to remedy flood-related infrastructure damage.
- The European Union allocates grants (Connecting Europe Facility; CEF) for infrastructure capital expenditures on Trans-European Networks (TEN).
In addition to investment grants, DB Group also receives (significantly lower) grants recognized as income, also mainly in respect of infrastructure.
On the balance sheet, investment grants are directly deducted from the purchase and manufacturing costs of the assets to which they relate. All grants are reported in such a way that the competent Federal agencies can conduct comprehensive checks to ensure that they are spent in accordance with their purpose and the law.
A description of the various forms of grants is available online.


